Dubai · H1 2026
0
homes sold above US$10 million
Three global property markets. Three different market conditions. The inaugural Signature Penthouses Index compares current published indicators across Dubai, London and Toronto to show how the upper residential landscape is diverging.
Dubai is recording exceptional activity in the US$10 million-plus residential segment. London is seeing stronger prime-market transactions while prices remain below prior levels. Toronto’s condominium market is recording higher sales and lower inventory while average prices remain below a year earlier.
The result is not a ranking of “best” markets. It is a picture of three cities at different points in the cycle—and a reminder that international buyers should compare market structure, not headlines alone.
A snapshot of the most important published indicators used in this edition of the Index.

Knight Frank recorded 296 Dubai homes selling above US$10 million in the first half of 2026, with total value reaching US$5.1 billion. Deal count rose 16% from H1 2025 and sales value rose 14%.

Knight Frank reported prime central and prime outer London transactions in the three months to August were 18% higher than a year earlier. Prime Central London activity rose 6%, while average PCL prices were 3.3% lower year over year.
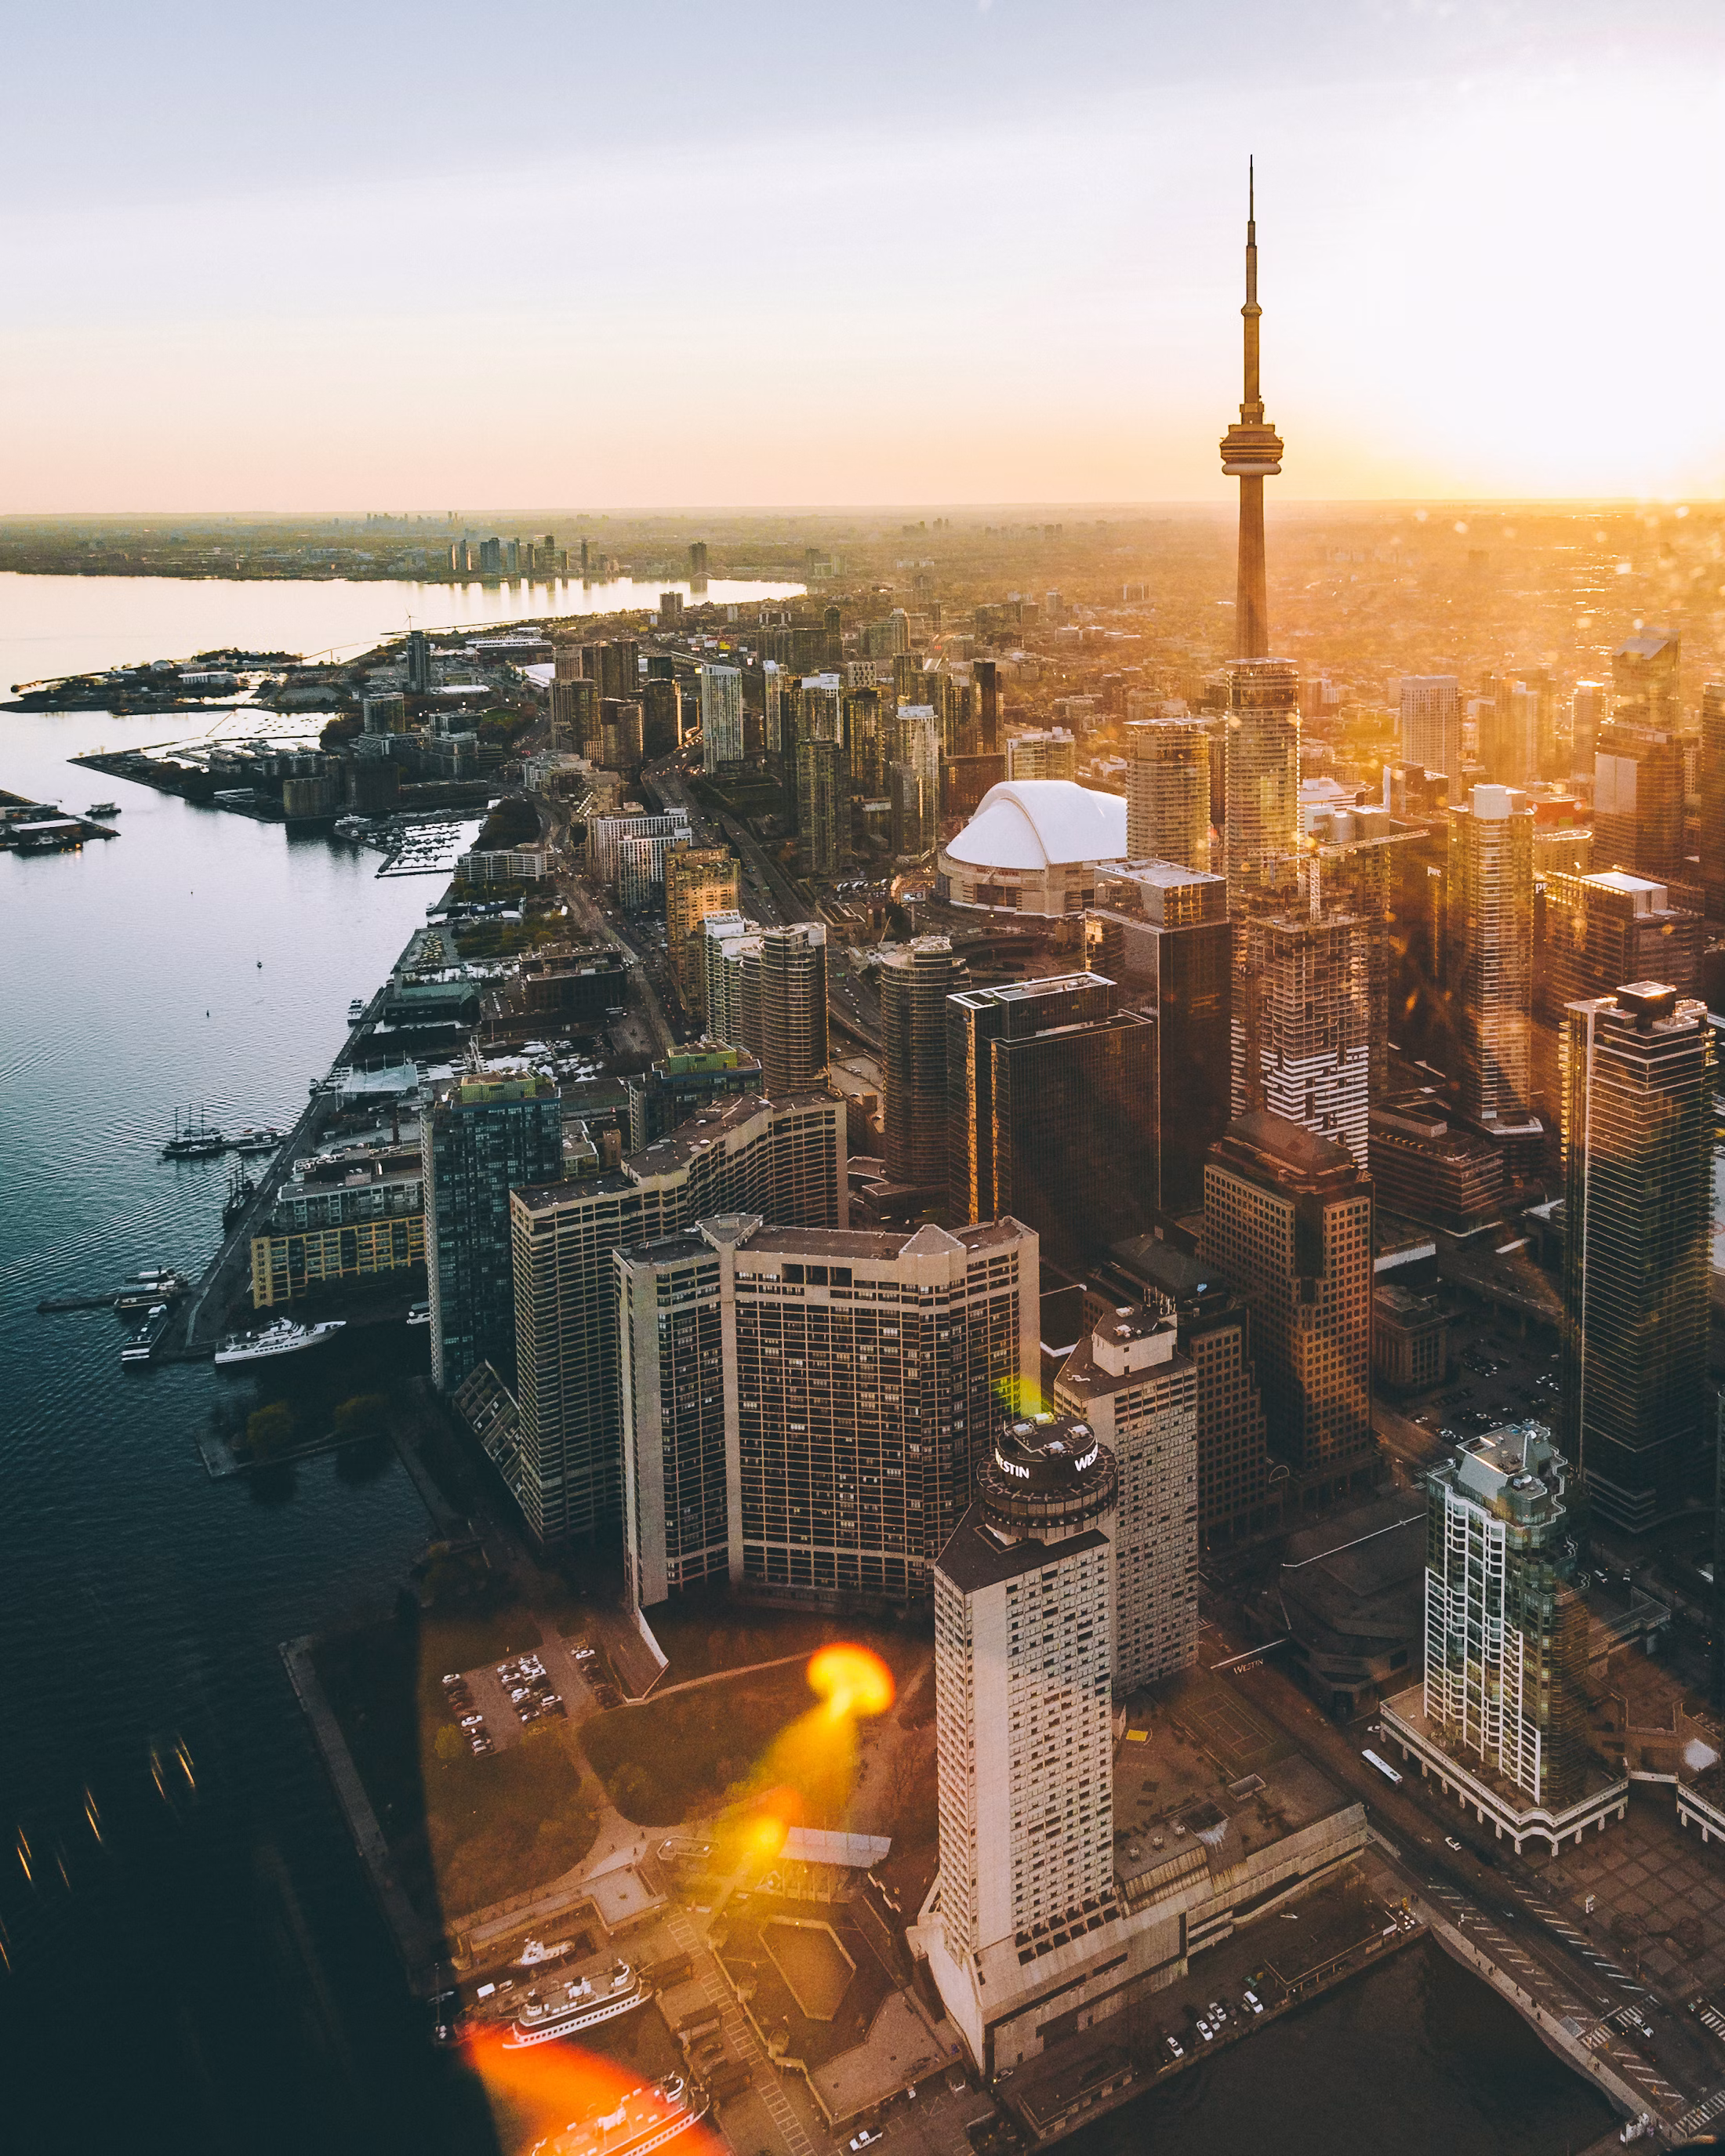
TRREB reported 4,783 GTA condominium apartment sales in Q2 2026, up 8.8% year over year. Active listings fell 15.4%, while the average selling price declined 7.5% to C$634,972.
Among the three markets in this Index, Dubai currently presents the clearest evidence of sustained transaction activity at the very top end of residential real estate.
The data supports a market profile defined by unusually high transaction volume and value in the US$10M+ segment. This does not mean every Dubai residential segment is rising equally; Knight Frank also noted softer conditions in parts of the mainstream market and near-term uncertainty.
London’s prime market is not behaving like Dubai’s. Recent data points to stronger transaction activity, but with Prime Central London prices still below year-earlier levels.
London illustrates why higher transaction activity does not automatically mean higher prices. Buyers are returning to parts of the prime market while still negotiating against a backdrop of lower values, taxation changes and economic uncertainty.
Toronto’s broader condominium market is showing an unusual combination: more sales, fewer listings and lower average prices than a year earlier.
The Toronto data suggests improving liquidity while buyers still retain meaningful negotiating power. Because consistent penthouse-only transaction data is not available across the three jurisdictions, this Index uses the GTA condominium market as a directional Toronto indicator rather than a penthouse-only measure.
This framework summarizes the direction indicated by the cited datasets. It is not an investment score or forecast.
“Luxury property is not moving in one direction globally. Dubai, London and Toronto are at different points in the cycle.”Signature Penthouses · 2026 Global Penthouse Market Index
The 2026 Global Penthouse Market Index is a comparative editorial market brief produced by Signature Penthouses using recently published third-party residential property data. It is intended to help readers understand current market direction across three cities without presenting unlike datasets as directly equivalent.
Where comparable penthouse-only datasets are not publicly available, the report clearly identifies the broader market indicator being used.
Dubai refers to US$10M+ residential transactions; London to Knight Frank prime markets; Toronto to TRREB condominium apartment statistics.
The market profiles summarize current published evidence. They are not forecasts, valuations, financial advice or recommendations to buy or sell property.
Property markets change. Readers should consult the linked source material and current local advice before making decisions.
Explore the dedicated Signature Penthouses city editions for curated penthouses, branded residences, prime resale and selected private-market opportunities.
Skyline icons, branded residences, waterfront penthouses and selected private inventory.
Prime Central London, Thames-facing residences and discreet private-market opportunities.
Yorkville, downtown skyline residences, waterfront homes and selected private opportunities.